Student Profile
Stanford Graduate School of Education believes that the best learning environment is one that includes multiple experiences and perspectives. Each year’s cohort reflects this belief with its wide range of backgrounds. Though each student has a unique story, they share a commitment to equitable, accessible, and effective learning for all.
Each year, our entering class profile is unique, differing from the year before and not predictive of a future cohort. We hope this profile gives you a sense of who makes up our newest community members.
2025-2026 By Program
As our applicant pool changes each year, so does our entering class. While we strive to have a consistent number of students in each incoming cohort, each student’s personal, academic, and professional background is different.
2,018
163
Students By Program
Demographics
The GSE embraces the diversity of our student body. In sharing details about our students, our goal is to be transparent about the composition of our newest community members.
Sex
Age
Average Age
25
Age Range
20 - 49 years
Domestic / International
U.S. students
88
Students of Color4
77% of U.S.
54% of total
54
First Generation5
37% of U.S.
33% of total
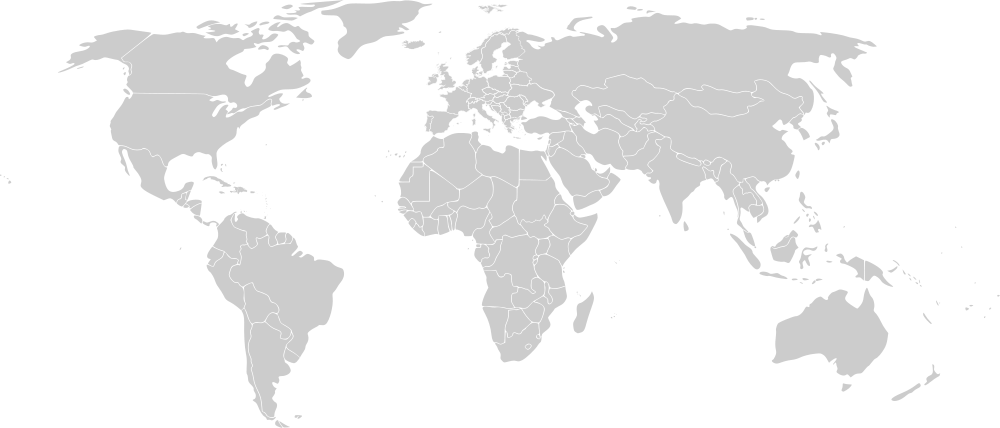
U.S. States and Countries Represented

States Represented
Countries Represented
States
Arkansas, Arizona, California, Colorado, Florida, Georgia, Hawaii, Illinois, Massachusetts, Minnesota, New Mexico, Nevada, New York, Ohio, Oklahoma, Oregon, Tennessee, Texas, Virginia, Washington
Countries
Australia, Brazil, Canada, China, Colombia, Haiti, India, Mexico, Mongolia, Nigeria, Pakistan, Russia, Singapore, Taiwan, United Kingdom, United States, Vietnam, Zambia
U.S. Student Demographics
Educational Background
GSE students have a variety of educational backgrounds, some within the field of education, some outside the field in areas such as social sciences, humanities, and engineering. There is no minimum GPA requirement for admission to our doctoral and master’s programs, nor is there a preferred educational background.
Undergraduate Majors (All)
| 3% |
Business / Marketing |
| 15% |
Education |
| 5% |
Engineering |
| 24% |
Humanities |
| 6% |
Math |
| 7% |
Natural Sciences |
| 39% |
Social Sciences |
Advanced Degrees
20%
Hold Advanced Degrees (Total)
73%
Hold Advanced Degrees (Doctoral Students)6
10%
Hold Advanced Degrees (Master's Students)

